
Bitcoin at the 200-Week MA: Is a W-Reversal Signaling a Bear Market Bottom?
Bitcoin is testing its 200-week moving average as a possible W-shaped reversal forms. Here’s why traders are watching BTC’s $60K–$65K zone closely.

Key Takeaways
- Bitcoin is trading near its 200-week moving average, one of the most important long-term technical zones.
- John Bollinger has flagged a possible W-shaped reversal pattern on Bitcoin’s daily and weekly charts.
- A confirmed breakout above the W pattern could weaken the downtrend that has been in place since late 2025.
- The $60,000–$65,000 range is now a key decision zone for BTC traders.
- The bullish setup is attractive because it combines technical structure, sentiment reset and macro bottoming psychology.
- The setup remains invalid if Bitcoin loses the 200-week moving average and fails to reclaim key resistance.
- Traders should watch volume, ETF flows, derivatives positioning and whether BTC can hold above reclaimed support.
Bitcoin is pressing into one of the most important long-term technical zones in crypto: the **200-week moving average**.
For long-term traders, this level is not just another moving average. It is a major cycle marker that has often helped define whether Bitcoin is in a deep-value accumulation zone, a structural downtrend or the early stage of a trend reversal.
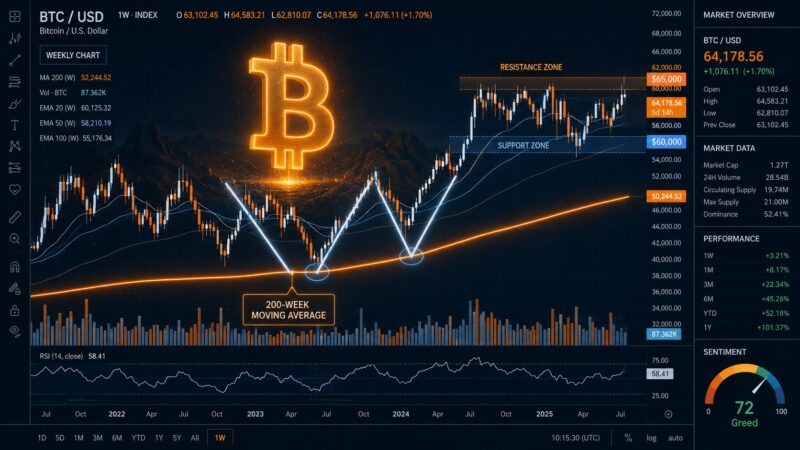
Now, BTC is trading near that zone while a possible **W-shaped reversal** is forming on the chart. That combination has attracted attention because it brings together three powerful ideas: classical technical analysis, bear market bottom psychology and clear invalidation levels.
At the time of writing, Bitcoin is trading around $62,600 after recently pushing above $63,000 and reversing part of its late-June losses.
The question is simple: **is Bitcoin forming a real bottom near the 200-week moving average, or is this another technical trap inside a larger bear market?**
Why the 200-Week Moving Average Matters
The 200-week moving average is one of Bitcoin’s most watched long-term technical indicators.
Bitbo describes the 200-week moving average as a tool that smooths short-term price fluctuations and helps traders identify Bitcoin’s long-term trend. When BTC trades consistently above it, the market is often interpreted as being in a stronger long-term trend. When BTC trades below it, traders may treat the market as being in a bearish or high-risk phase.
Historically, Bitcoin’s interaction with the 200-week moving average has often reflected market exhaustion.
During deep bear markets, BTC has either tested, briefly broken or traded near this level before eventually building a stronger base. That does not mean the 200-week MA guarantees a bottom. It means the level often attracts long-term buyers, cycle analysts and contrarian investors.
This is why the current setup matters. Bitcoin is not only bouncing from a random support area. It is testing a zone that many traders view as a long-term value area.
Bitcoin Recently Closed Below a Critical Long-Term Level
The 200-week moving average is especially important now because Bitcoin recently suffered serious technical damage.
Kiplinger noted that Bitcoin closed below its crucial 200-week moving average for the first time since the 2023 cyclical bottom, while broader retail sentiment appeared washed out after a steep drawdown from prior highs.
That kind of breakdown usually changes how traders read the market.
A simple bounce is not enough. After Bitcoin loses a major long-term moving average, traders usually want to see a reclaim, a successful retest and stronger follow-through before calling a new uptrend.
That is why the current W-reversal setup is important. It could provide the first structure showing that buyers are trying to rebuild control.
John Bollinger Flags a Possible W-Reversal
The W-reversal narrative gained traction after John Bollinger, creator of the Bollinger Bands indicator, highlighted a possible W-shaped double-bottom structure on Bitcoin.
According to Cointelegraph’s report carried by TradingView, Bollinger said Bitcoin appeared to be on the final leg of what could become a major W-shaped reversal pattern. He also noted that a successful setup could potentially break the downtrend that has been in place since October 2025.
The same report noted that Bollinger was watching the pattern on both daily and weekly time frames, with smaller W structures appearing near the lows and a larger W formation emerging across broader time frames.
That matters because fractal alignment across multiple time frames can make a technical setup more meaningful.
A daily W pattern can suggest short-term reversal potential. A weekly W pattern can suggest broader cycle repair. When both appear near a major long-term moving average, traders pay attention.
What Is a W-Reversal?
A W-reversal is a classic double-bottom structure.
It usually forms when price falls into a low, rebounds, fails to fully recover, drops again into a second low and then attempts to break above the middle resistance area between the two lows.
The pattern matters because it shows a possible shift in market behavior.
In a strong downtrend, each bounce usually fails and sellers keep control. In a W-reversal, the second low may show that sellers are losing strength. If price breaks above the middle resistance, traders may interpret it as confirmation that buyers are taking control.
For Bitcoin, this structure is especially important because the market has spent months under pressure. A confirmed W-reversal could signal that BTC is no longer simply making lower lows and lower highs.
But confirmation is critical.
A W pattern is not complete just because the shape appears. It usually needs a clean breakout above resistance, stronger volume and a successful retest.
The $60K–$65K Zone Is the Key Battlefield
The current Bitcoin setup revolves around the **$60,000–$65,000 range**.
The $60,000 area matters because it has become a major psychological and technical support zone. Bitcoin’s ability to reclaim and hold this area has helped stabilize sentiment after a difficult June.
The $65,000 area matters because some technical analysts have identified it as the breakout zone that could confirm the W-reversal structure. A report summarizing Bollinger’s view noted that Bitcoin may need to break above $65,000 for the fractal W pattern to signal a meaningful end to the downtrend.
This creates a clear technical map.
If Bitcoin holds above the 200-week moving average and breaks above $65,000 with strong volume, the bullish reversal case becomes stronger.
If BTC fails near $65,000 and falls back below the 200-week moving average, the setup weakens quickly.
Why the Setup Is Attractive
The setup is attractive because it combines multiple signals in one place.
First, Bitcoin is near a long-term technical zone watched by cycle traders.
Second, the market has already gone through a major sentiment reset. After a steep drawdown, traders are no longer euphoric. Bearish narratives, ETF concerns and macro caution have all become more visible.
Third, the W-reversal provides a clear structure. Traders can define invalidation more easily because the pattern has obvious support and resistance levels.
Fourth, the setup comes after Bitcoin recently reclaimed $60,000. Cointelegraph’s report noted that institutional interest was slowly returning as the newly reclaimed $60,000 level held.
Fifth, the broader market is watching whether Bitcoin can reverse the downtrend that began after its late-2025 peak.
Together, these conditions create a high-interest technical moment.
Why the Setup Is Still Risky
The setup is not risk-free.
Bitcoin is still recovering from a deep correction. A move into the 200-week moving average does not automatically mean a durable bottom is in place. In weak markets, major moving averages can act as resistance rather than support.
That is the key risk.
If Bitcoin only retests the 200-week MA from below and fails, traders may interpret the move as a bearish rejection. In that scenario, the W-reversal could turn into a failed pattern, trapping late buyers.
Another risk is volume. A breakout without strong spot volume is less convincing because it may be driven by short covering rather than genuine accumulation.
A third risk is macro liquidity. Even the best technical setups can fail if broader financial conditions tighten, the U.S. dollar strengthens or risk appetite weakens.
A fourth risk is ETF flow pressure. Bitcoin’s institutional demand structure has changed since spot ETFs became a major market force. Technical breakouts now need confirmation from flows and liquidity, not only chart patterns.
What Would Confirm the Bullish Case?
A bullish confirmation would likely require several signals.
The first signal is a clean breakout above the W-reversal neckline. For many traders, this area sits near the mid-$60,000 range.
The second signal is strong volume. A confirmed reversal should show buyers stepping in with conviction.
The third signal is a successful retest. If Bitcoin breaks above resistance and then holds that level as support, confidence improves.
The fourth signal is improving ETF flows. Institutional demand has become an important part of Bitcoin’s market structure.
The fifth signal is stronger market breadth. If Ethereum, Solana, XRP and other large-cap assets also recover, it would show broader risk appetite returning.
The sixth signal is derivatives stability. A healthy move is stronger when it is not driven only by forced short liquidations.
What Would Invalidate the Setup?
The invalidation is also relatively clear.
The W-reversal thesis weakens if Bitcoin loses the 200-week moving average and fails to reclaim it quickly.
It weakens further if BTC breaks below the second low of the W pattern. That would suggest buyers failed to defend the structure and the broader downtrend remains intact.
The setup also becomes less credible if Bitcoin rejects sharply from the $65,000 area with weak volume and rising sell pressure.
In that case, traders may view the rebound as another bear market rally rather than a true reversal.
This is why the current setup is useful. It does not require vague prediction. It gives traders a framework with clear confirmation and invalidation zones.
Macro Bottoming Psychology Is Also in Play
Technical patterns matter, but market psychology matters too.
Bear market bottoms often form when sentiment is damaged, investors are cautious and rallies are doubted. That appears to be part of the current environment.
Bitcoin has gone through a severe drawdown, retail confidence has weakened and many traders are waiting for confirmation before re-entering the market. This is often how bottoming phases begin.
However, bear markets also produce many false starts.
A market can bounce strongly, create a convincing reversal pattern and then fail if buyers do not follow through. That is why traders should not rely on the W shape alone.
The stronger signal would be a combination of technical breakout, improving liquidity, better ETF flows and renewed institutional demand.
How Traders Are Reading the 200-Week MA Now
There are two main interpretations of Bitcoin’s 200-week MA test.
The bullish interpretation is that Bitcoin is reclaiming a historical cycle support zone. Under this view, the market is transitioning from panic selling to accumulation. The W-reversal could mark the first visible sign of trend repair.
The bearish interpretation is that Bitcoin is retesting a broken long-term support level from below. Under this view, the 200-week MA may become resistance, and the W structure may fail if BTC cannot break above the neckline.
Both interpretations are valid until the market confirms direction.
That is why the next few candles matter. Bitcoin does not need to rally vertically, but it does need to hold the reclaimed zone and avoid a sharp rejection.
What Traders Are Watching Next
Traders are watching several signals now.
The first signal is whether Bitcoin holds above the 200-week moving average.
The second signal is whether BTC can break and hold above the $65,000 area.
The third signal is spot volume. Without volume, the W-reversal remains less reliable.
The fourth signal is ETF flow data. A return to inflows would support the idea that institutional demand is improving.
The fifth signal is options and derivatives positioning. If traders remain heavily hedged, upside may be limited unless a squeeze develops.
The sixth signal is altcoin participation. A healthier recovery should not be limited to Bitcoin alone.
The seventh signal is macro data. Fed policy, dollar strength and liquidity expectations remain important for risk assets.
Is This a Bear Market Bottom?
Bitcoin may be building a bottom, but it is not confirmed yet.
The strongest bullish evidence is the combination of the 200-week moving average, the potential W-reversal and the market’s ability to reclaim the $60,000 area.
The strongest bearish evidence is that Bitcoin recently suffered long-term technical damage and still needs to break higher before the trend has clearly changed.
This means the current setup should be treated as a decision zone, not a final answer.
A confirmed W-reversal above key resistance could strengthen the case that Bitcoin’s bear market is ending. A failed breakout could turn the setup into another trap.
Near-Term Outlook
The near-term outlook depends on whether Bitcoin can convert the 200-week moving average from a danger zone into a support zone.
If BTC holds above the 200-week MA, breaks above the W neckline and attracts stronger volume, traders may begin positioning for a larger recovery.
If BTC fails near resistance and loses the 200-week MA again, the market may return to a defensive posture.
For now, the chart is constructive but unfinished.
Bitcoin has a potential reversal structure. It has a major long-term technical level. It has clear invalidation. But it still needs confirmation.
Final Thoughts
Bitcoin’s test of the 200-week moving average is one of the most important technical setups of 2026.
The possible W-shaped reversal flagged by John Bollinger adds to the significance of the moment. If the pattern confirms, it could signal that the downtrend from late 2025 is weakening and that Bitcoin is entering a bottoming phase.
But traders should avoid assuming the bottom is already confirmed.
The strongest market signals will come from a clean breakout, strong volume, a successful retest, improving ETF flows and broader crypto market participation.
Until then, Bitcoin’s 200-week MA test remains a high-conviction watch zone — not a guaranteed reversal.
This article is for market information and educational purposes only. It should not be considered financial advice.
Internal Link Suggestions
- Bitcoin Near $60K: Is This a Bottom or Another Bear Market Trap?
- Crypto Macro Outlook 2026: Liquidity, ETF Flows and Bitcoin’s Cycle Risk
- Are Bitcoin ETFs Still Driving the Crypto Market in 2026?
- CLARITY Act July Push: Why U.S. Crypto Regulation Is Back in Focus
- AI and Crypto in 2026: Hype or the Next Big Blockchain Narrative?
James Carter covers Bitcoin, crypto regulation, and institutional digital asset adoption. He focuses on explaining market developments in clear, accessible language for everyday readers.
The author may hold BTC and ETH. This content is for informational purposes only.